Project FeederWatch State Reports
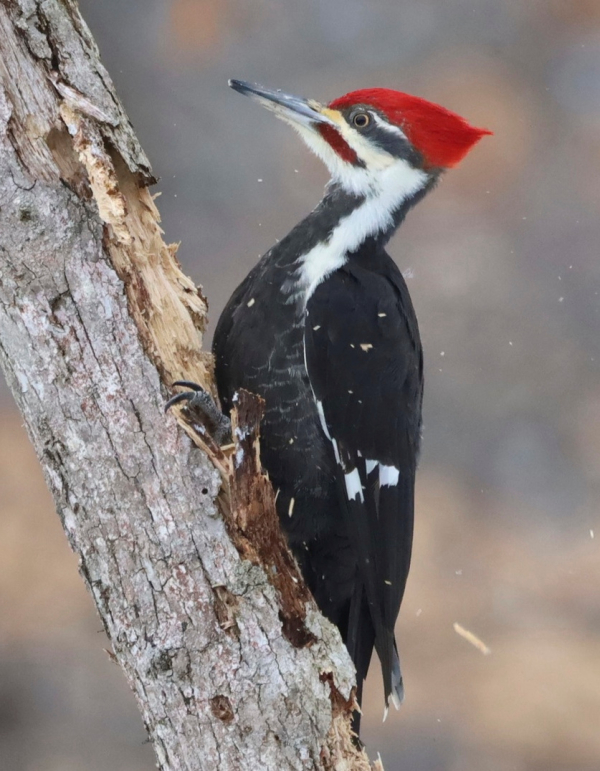
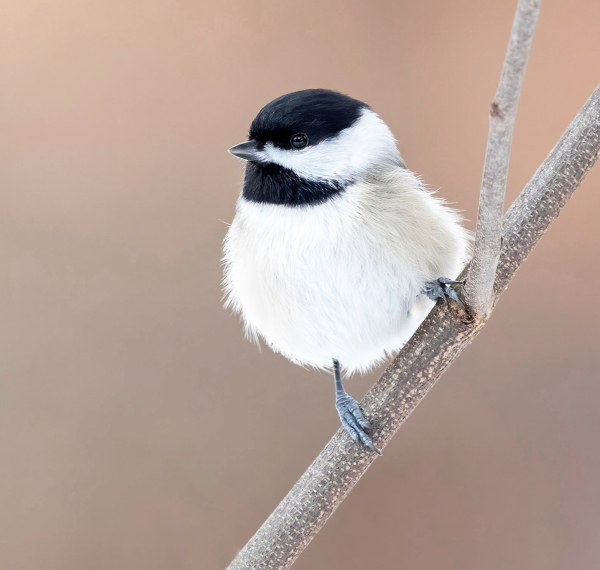
How many Carolina Chickadees are being counted at feeders in Georgia? (photo by Brad Imhoff)
Among the most interesting and insightful information sources birders can reference are Project FeederWatch’s 2-week state reports that show the variety of species being reported and their abundance at feeders in your state – and every state and province. It’s exciting to monitor the advancing season in 2-week increments as new species appear and others move on, and see abundance levels change through the season, which began in November and ends in April. It’s easy and interesting to see what other birders in your state are seeing out their windows, and to compare the feeder birds that visit your feeding station with statewide lists.
While viewing the information provided, keep in mind that most states have a north-south or east-west variety of species, while some states and provinces have altitudinal changes or a coastal variant, so there can be quite a variety of birds reported on a statewide level. Even so, the 2-week reports provide a wealth of info to review, including changes over the length of the winter from November 13th to the present. It’s also interesting to see the kinds of birds being seen in neighboring states and provinces cross-country; for example, if you live in Pennsylvania, take a look at the lists for Arizona and Alberta. That’s part of the fun too.
Some of the obvious things you can do when you visit the Project FeederWatch Reports page, is to scroll down the list of all the species observed to date. You can do that alphabetically or taxonomically, whichever suits you best. Just click your preferred option in the upper left side of the chart. The “Alphabetical” mode is self-explanatory, but if you want to check the different species of woodpeckers at once, or all the hummingbirds or raptors in the same view, the “Taxonomic” option is best. By the way, if you click the word “Taxonomic” twice, it will switch the order of the species from the bottom to the top (it’s hard to describe, but take our word for it, you’ll see).
It’s also a good thing to check just how many people are participating in FeederWatch activities in the state or province you are viewing, which you can see at the bottom of the chart – just to get a baseline for the statistics that are being provided. In the upper right side of the chart, you can also click on the “Average group size” to sort the chart by the size of the group, starting from 1 and increasing as you scroll downward.
To get started reviewing these interesting FeederWatch reports, see Project FeederWatch Reports by State
If you get inspired, you can still participate in Project FeederWatch; see how at FeederWatch – Count Feeder Birds for Science
And don’t forget about the Great Backyard Bird Count coming up this weekend – February 18 thru 21. For more information, see How to Participate – Great Backyard Bird Count Keep those feeders and water features filled daily this winter, and all the birds you see.
Share your backyard birding experiences and photos at editorstbw2@gmail.com


